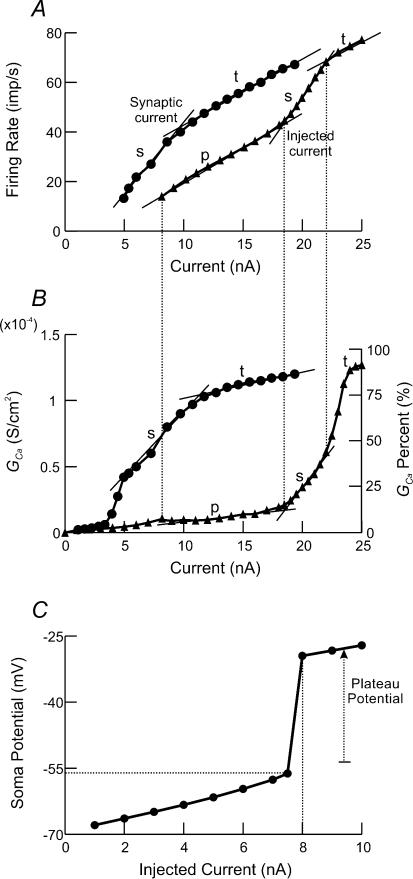
Figure 7. Comparison of the efficacy of intracellular current injection in activating the PIC to that of synaptic excitation.
A, comparison of F–I relationships evoked by synaptic activation (circles) and intracellular current injection (triangles) at the soma. B, steady-state magnitude of GCa measured for the F–I relationships in A. Right axis shows the percentage increase in GCa relative to its maximum achievable value. C, steady-state somatic membrane potential in response to intracellular long current pulses injected at the soma. Horizontal dashed line shows the somatic plateau threshold (–56 mV). Vertical dashed line shows the current level at which the somatic plateau threshold takes place (8 nA).

