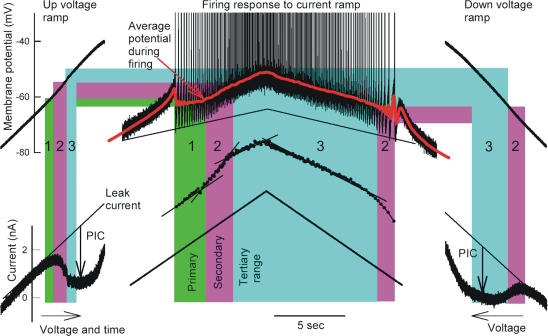
Figure 9. Graded activation of Ca2+ PIC in rat motoneurone.
Overlay of the experimentally measured firing rate (centre) and Ca2+ PIC (both sides) during ascending and descending ramp current- and voltage-clamp experiments, respectively, from a real rat motoneurone (data adapted from Fig. 2B and C in Li et al. 2004). The regions were marked as the primary, secondary and tertiary ranges of firing, and their corresponding locations on the I–V relationship were determined by using the filtered potential during firing (line labelled ‘Average potential during firing’; 2 Hz low pass filter raw data) corresponding to the top and bottom of each range.

