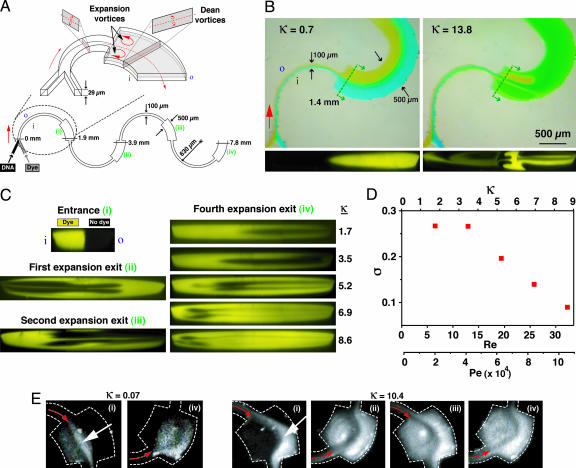
Fig. 4.
Multivortex phenomena in an ASM design. (A) Schematic of coupled transverse Dean (vertical plane) and expansion vortex (horizontal plane) effects in the vicinity of an abrupt increase in width from 100 to 500 μm over the last quarter of each semicircular arc (29 μm tall; 630 μm radius of curvature; Re, κ computed based on the 100-μm-wide segment; i and o denote inner and outer walls, respectively). (B) Top-view images (Upper) and corresponding confocal cross-sectional images (Lower) taken at the entrance to an expansion in width from 100 to 500 μm occurring 1.5 mm downstream from the entrance depicting vortex formation with increasing κ. (C) Confocal cross-sectional images taken at downstream positions indicated in A at Re = 32.2 and κ = 8.6. Images taken at the end of the fourth expansion (position iv in A) are also shown at flow rates ranging from 6.4 < Re < 32.2 (1.7 < κ < 8.6). As κ is increased, the two species become almost completely intermixed, as indicated by uniform fluorescence over the channel cross-section. (D) Plot of σ at position iv in A computed from the confocal image sequence in C as a function of the Dean, Reynolds, and Péclet numbers (Pe was computed using D = 3 × 10⁻⁶ cm2/s for Rhodamine 6G). (E) Binding enhancement between dsDNA (calf thymus, 2.5 μg/ml) and an intercalating dye (ethidium bromide, 50 μg/ml) with increasing κ (dashed lines denote the microchannel walls). Images were taken at the positions indicated in A; red arrows indicate the flow direction, and white arrows indicate increased fluorescence above the background level of the unbound dye due to intercalation at the interface between streams.

