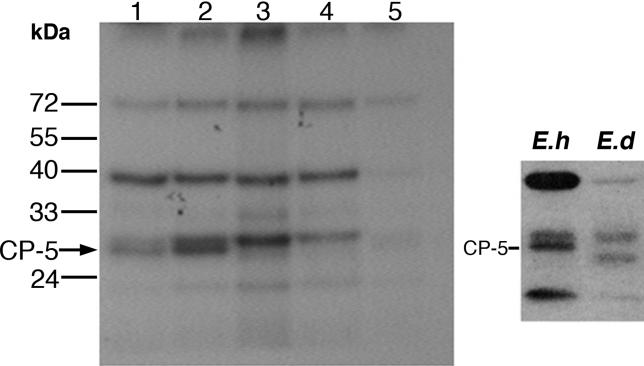
Figure 6. In Vivo Labeling of Cysteine Proteinases.
The different trophozoite cultures were grown for 18 h with the radiolabeled cysteine proteinase inhibitor Fmoc-[I125]Tyr-Ala-diazomethylketone (10 μg/ml, 10 μCi/ml), harvested, washed, and lysed [49]. Samples of each cell lysate (25 μg) were separated on a 12% acrylamide reducing gel and exposed to X-ray film to reveal the different cysteine proteinase bands. Samples in the lanes on the left radiograph are: 1, untransfected HM-1:IMSS; 2, untransfected G3; 3, G3 transfected with pAP-CP5 and grown with 50 μg/ml of G418; 4, RB8 trophozoites after removal of the plasmid (see Results); 5, HM-1:IMSS grown with a lower specific activity inhibitor (0.05 μCi/μg). Samples on the right radiograph demonstrate the CP-5 band location in HM-1:IMSS and its absence from the E. dispar culture [50].

