
Figure 2.
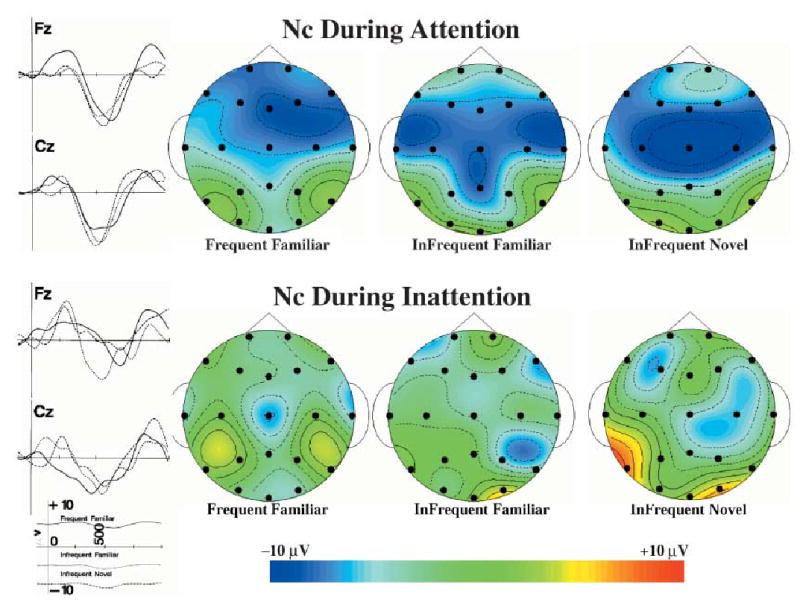
The Nc component during attention and inattention. The ERP recording from 100 ms prior to stimulus onset through 1 s following stimulus is shown for the FZ and CZ electrodes for attentive (top figures) and inattentive (bottom figures) periods, combined over the three testing ages. The topographical scalp potential maps show the distribution of this component for the three memory stimulus types in attention and inattention. The topographical maps represent an 80-ms average of the ERP for the Nc component at the maximum point of the ERP response. The data are plotted with a cubic spline interpolation algorithm and represent absolute amplitude of the ERP.