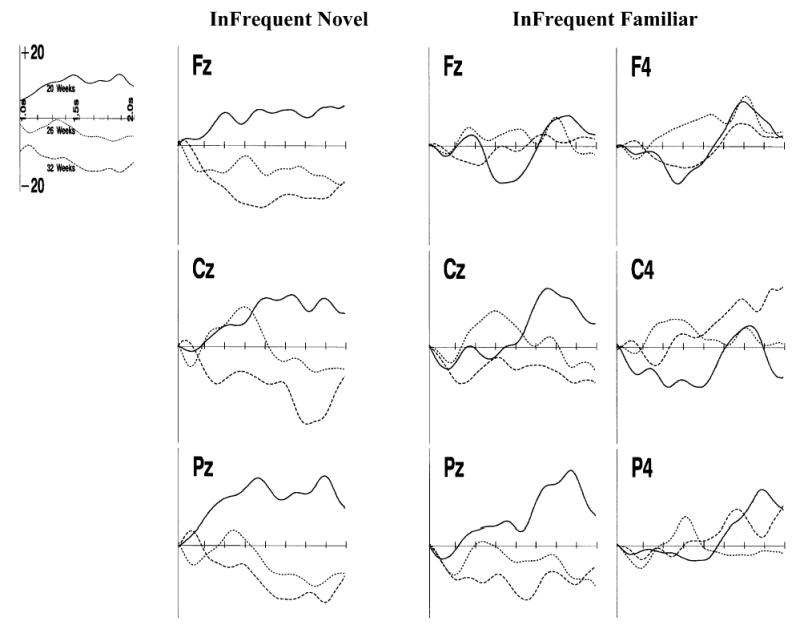
Figure 4.

The late slow wave responses in the ERP. This figure shows the ERP from the FZ, CZ and PZ electrodes for the infrequent novel stimulus presentations (left figures), the center and center-right electrodes for the infrequent familiar stimulus presentations, separately for the three testing ages. The data are presented from 1 s to 2 s following stimulus onset. The data are presented as the difference from the ERP on the frequent familiar stimulus presentations.
