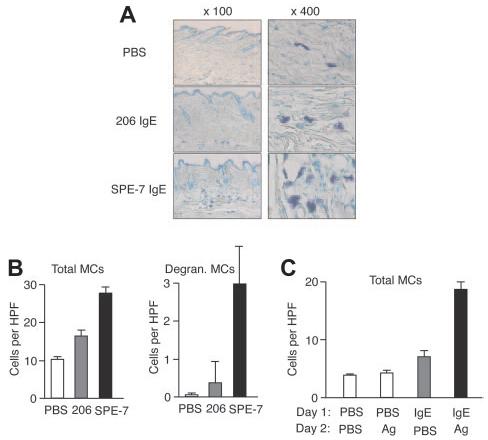
Figure 6.

In vivo models for IgE- and IgE+Ag-induced mast cell accumulation. (A) Gauze strips spotted with 10 μg/mL 206 or SPE-7 IgE or PBS were applied to the shaved back skin of naive NC/Nga mice for 24 hours. The mice were killed and skin samples were prepared to stain mast cells. Representative photomicrographs are shown. (B) Total and degranulating mast cell numbers per high-power field were counted. (C) NC/Nga mice were first treated with anti-DNP (206) IgE or PBS on the back skin, and 1 day later the same area was applied with gauze strips spotted with DNP-HSA or PBS for 24 hours. Total mast cell numbers per high-power field were counted. Data (mean values ± SD) are shown representative of 3 similar experiments.
