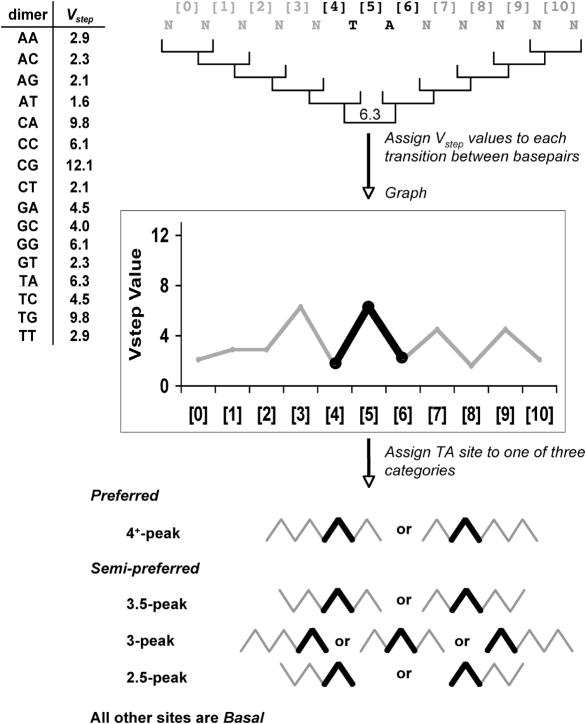
Figure 1.
Profiling TA sites using the Vstep algorithm. Sequences of 12 bp (N) with TA sites at positions six and seven were analyzed with respect to the 11 Vstep values ([0]–[10]) for transitions from one base pair to the next (brackets). Profiles are charted and subsequently assigned to one of three categories, preferred, semi-preferred or basal, based upon the graphical pattern. In all profiles there is a ‘TA-peak’ that always exists in such profiles because the T-to-A Vstep value is 6.3 and all steps from N to T and from A to N (N = any base) are always <3.0, as shown on the left side of the figure. The ‘TA peak’ formed by the two lines that connect the three Vstep values for the N-to-T, T-to-A and A-to-N steps are shown in boldface.

