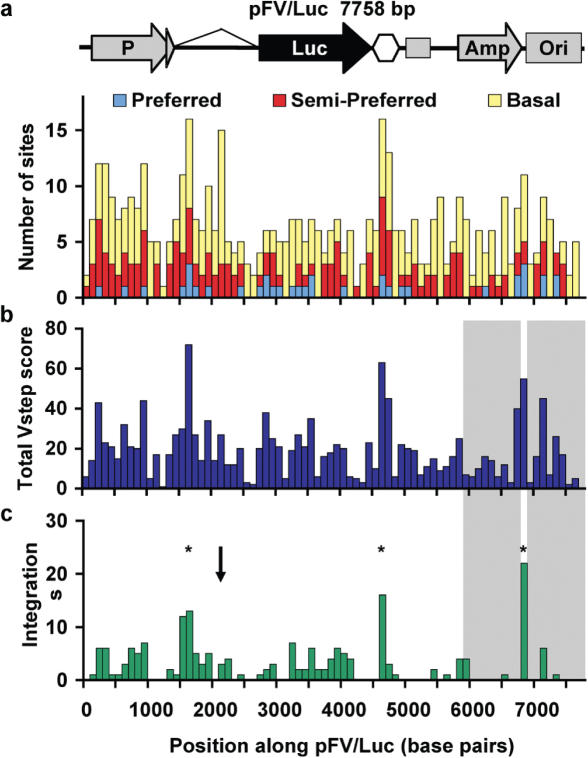
Figure 2.
Total Vstep profile of the 7758 bp plasmid pFV/Luc. The sequence is divided into 78 bins of size100 bp. (a) Plot of the number of each type of TA site per bin. The hexagon indicates the Chinook salmon poly(A) addition motif and the following square indicates an M13 origin of replication. (b) Plot of Total Vstep score per bin. (c) Distribution of observed insertion sites [adapted from Liu et al. (23)]. Shaded areas are regions required for selection and thus unlikely to be scored. The asterisks indicate the three most likely regions for integration based on ProTIS analysis and the arrow indicates a region that has a high number of TA sites, but relatively few integrations.

