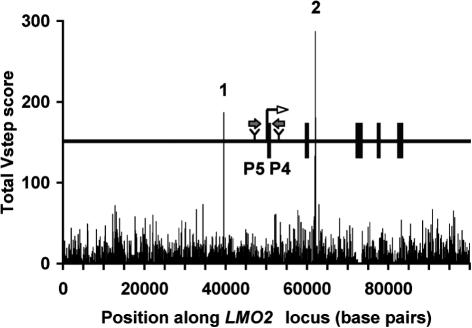
Figure 5.
Total Vstep Profile for the human LMO2 gene plotted as 100 bp bins. The map of 100 kb of the LMO2 locus is shown above the center of the Vstep profile. Rectangles, exons; block arrows, sites of two activating retroviral insertions [P4 and P5, Ref. (36)]. Spikes 1 and 2 in the Total Vstep profile correspond to short tandem repeats of (TCTA)n and (TA)n, respectively.

