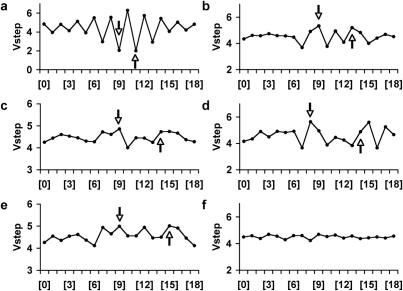
Figure 6.
Vstep analysis of insertion sites of proviruses and transposons. The arrows in the profiles indicate the boundaries of the TSD sequence that occurs with the staggered cuts made by the various integrase enzymes. (a) Average Vstep profiles for 573 SB transposon integrations. (b) Average Vstep profiles for murine leukemia virus. (c) Average Vstep profiles for human immunodeficiency virus. (d) Average Vstep profiles for simian immunodeficiency virus. (e) Average Vstep profiles for avian sarcoma/leucosis virus. (f) Average Vstep profiles for 1006 random DNA 20mer sequences.

