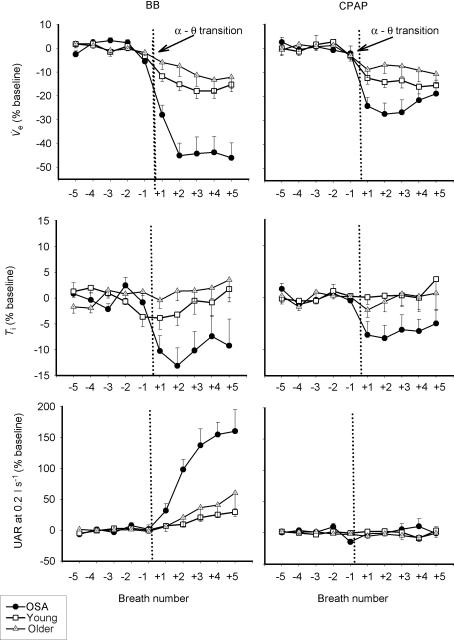
Figure 5. Breath-by-breath mean (± s.e.m.) changes in inspiratory minute ventilation ( top), inspiratory duration (Ti, middle) and upper airway resistance (UAR at 0.2 l s−1, bottom), as a percentage of the stable α baseline during basal breathing and CPAP.
Even with application of nasal CPAP and no rise in resistance at the α–θ transition, ventilation fell to a greater degree in the OSA patients, primarily due to a larger reduction in inspiratory duration. •, OSA; □, young; ▵, older.

