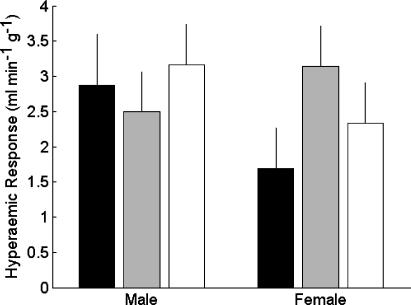
Figure 2. Hyperaemic response for male and female hearts at the onset of reperfusion.
Mean increases in coronary flow from the end of ischaemia (minute 60) through the first minute of reperfusion (minute 61) are plotted as means ± s.e.m. Black bars represent Sed (n = 8 males and 8 females), grey bars represent 1 day (n = 10 males and 8 females), and white bars represent 5 day (n = 6 males and 6 females) hearts. No statistically significant differences were observed in the hyperaemic response from hearts in the study.

