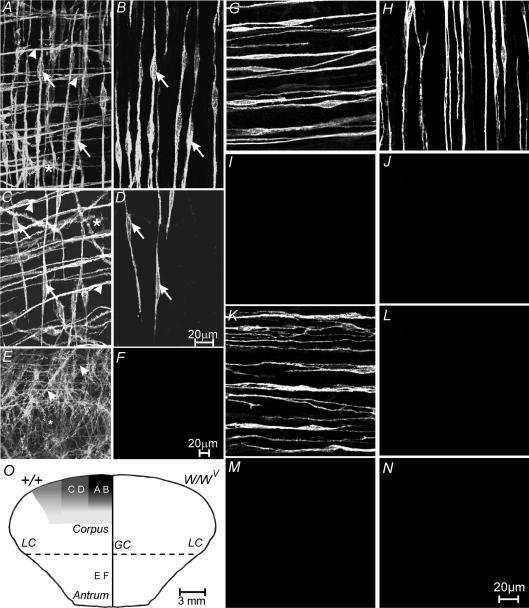
Figure 2. Density of ICC-IM in the gastric corpus and antrum around the stomach in wild-type, and ICC-IM in the corpus and antrum of W/WV mutants.
A, the density of ICC-IM within the circular and longitudinal muscle layers (arrowheads and arrows, respectively) and ICC-MY (*) within the myenteric plexus region at a distance of 2 mm from the greater curvature (GC). B, a confocal reconstruction of the longitudinal muscle layer from the same image as shown in A, and revealing the density of ICC-IM within the longitudinal muscle layer (arrows). C, the reduction in density of ICC-IM and ICC-MY at a distance 6 mm from the greater curvature. D, a confocal reconstruction of ICC-IM within the longitudinal layer (arrows) from the image in C. Note the drop in density of ICC-IM in the longitudinal layer towards the lesser curvature (LC). E and F, distribution of ICC in the gastric antrum. E, a confocal reconstruction through the entire tunica muscularis. ICC-IM within the circular muscle layer (arrowheads) and ICC-MY at the level of the myenteric plexus can be observed. However ICC-IM within the longitudinal muscle layer are absent. F, a confocal reconstruction through the longitudinal muscle layer of the same image confirming the absence of ICC-IM in this layer. G–N, ICC-IM in the circular and longitudinal muscle layers of wild-type and W/WV mutant animals. G and H, ICC-IM in the circular and longitudinal muscle layers in the corpus of wild-type controls. I and J, the absence of ICC-IM in the circular and longitudinal layers in the corpus of W/WV mutants. K and L, ICC-IM in the circular (K) but not the longitudinal layer (L) in the antrum of wild-type controls. M and N, the absence of ICC-IM in the circular and longitudinal layers in the antrum of W/WV mutant animals. O, a diagrammatic reconstruction of the density of ICC in the longitudinal layer of the corpus and antrum of wild-type (+/+, left side) and W/WV mutant (right side) animals. The greatest density of ICC-IM (black zone on the left labelled from A and B) was observed adjacent to the greater curvature (GC), and decreased in density towards the lesser curvature (LC; C and D). No ICC-IM were observed in the antrum of +/+ animals or in the corpus and antrum of W/WV mutants (right hand side of O). Scale bar in D is representative for panels A–D. Scale bar in F is representative for E and F. Digital reconstructions were 20 × 1.3, 4 × 1.3, 10 × 1.1, 3 × 1.0 and 3 × 1.1 μm in A–D, and 25 × 0.5 and 4 × 0.5 μm in E and F, respectively. Scale bar in N applies to G–N.

