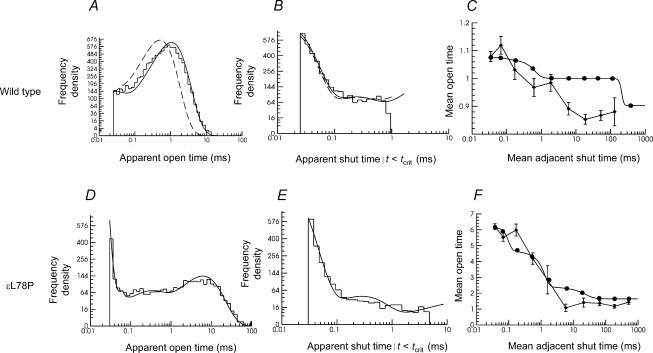
Figure 7. Example of a test of the adequacy of a fit obtained with Scheme 3.
Histograms show the distributions of observed open and shut times from patches with 100 nm ACh for wild-type and εL78P receptors. The HJC distributions of apparent open and shut time with a resolution of 30 μs, calculated from the results of fitting Scheme 3, are overlaid as continuous lines on the histograms, and conditional mean open time plots are shown, as in Fig. 5.

