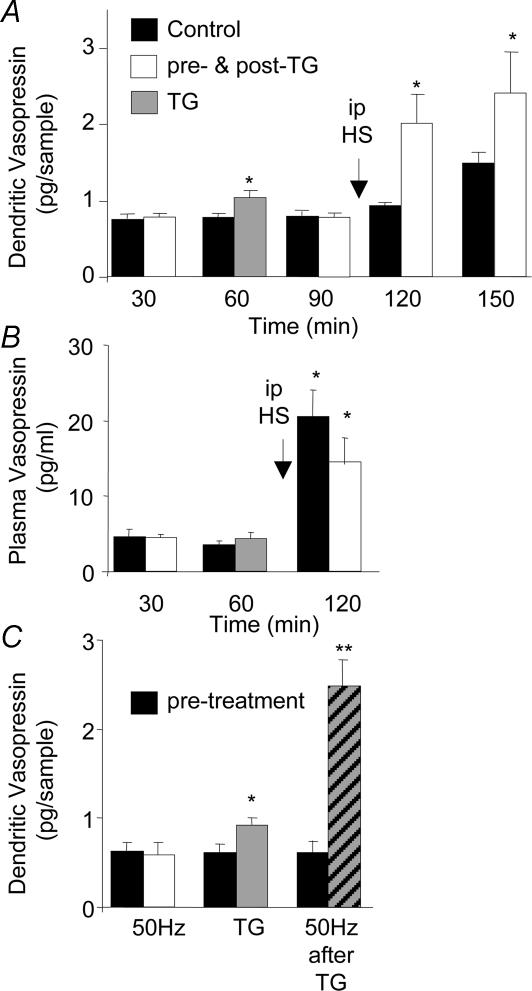
Figure 1. Vasopressin release in the SON.
A, release after intraperitoneal (i.p.) injection of hypertonic saline (HS) after dialysis of one SON with thapsigargin (TG, 200 nm, given during the second 30-min dialysis interval) or control solution. n = 6, *P < 0.05, analysis of variance (ANOVA). B, vasopressin measured in the plasma in the same experiments as A. *P < 0.05, compared to basal. C, vasopressin release in the SON before (black columns) and in response to electrical stimulation of the neural stalk (white columns) or thapsigargin (grey column) and electrical stimulation after exposure of one SON to thapsigargin (hatched column). Data are means ± s.e.m., n = 8, *P < 0.05, **P < 0.01, compared to controls, t tests.

