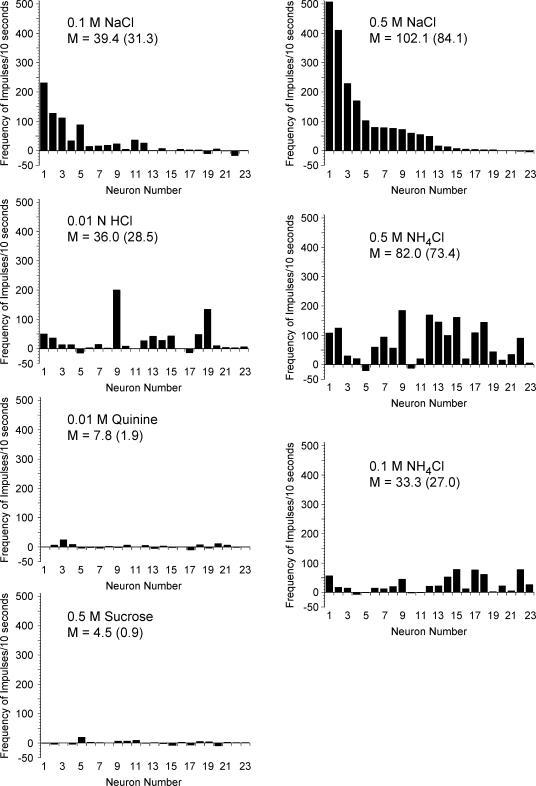
Figure 3. Response frequencies above spontaneous activity for individual geniculate ganglion neurones that innervated taste receptors on the tongue.
Each neurone was assigned a number based on its frequency of response to 0.5 m NaCl and ordered with the same neurone number for each stimulus. Therefore, the pattern of activity can be tracked for each individual neurone across all stimuli. The mean (M) of all frequencies greater than 0 is presented. The mean across all neurones is included in parentheses for comparison.

