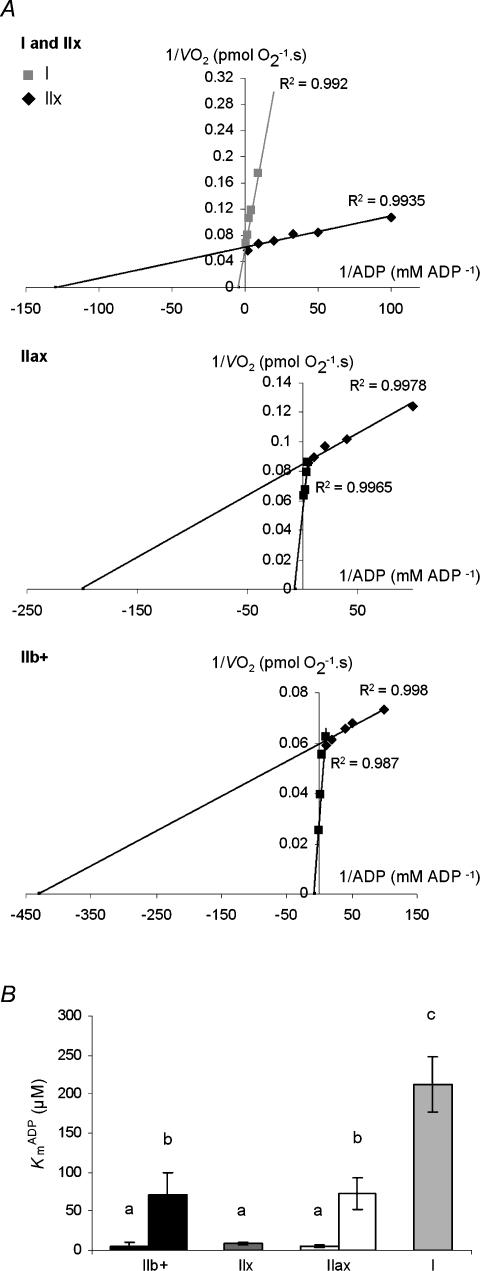
Figure 4. Kinetics of ADP-stimulated respiration in type IIb +, IIx, IIax, and I fibre bundles.
A, Lineweaver–Burk linearization of changes in respiration rates as a function of ADP concentration in representative experiments. Upper panel, type I and IIx; middle panel, IIxa; and lower panel, IIb+ fibre bundles. Note that in IIax and IIb+ fibre bundles, two linear segments are delineated by maximization of R2. B, influence of fibre bundle type on mitochondrial apparent Km for ADP. Values are means ± s.e.m. (n = 8). Different superscripts represent significantly different values.

