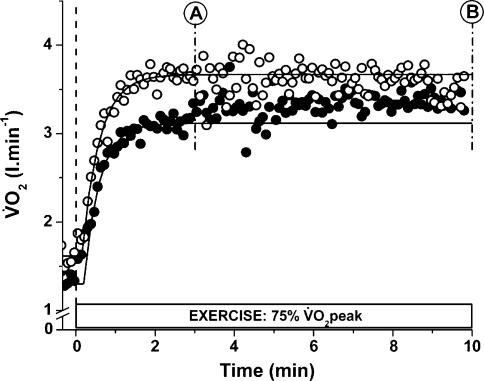
Figure 2. The  response to constant work rate submaximal cycle ergometer exercise with (AC) and without (CON) prior heavy exercise.
The Figure shows the results from a typical subject, time aligned to the start of either CON (o) or AC (•) exercise. The data are the average of three trials up to point A (3 min) after which the data represent the average of two trials (as during the 2B trial the exercise was briefly interrupted for the biopsy procedure at 3 min). The exponential fits are modelled from the phase II exponential region or to 3 min (whichever was the sooner) and the slow component was measured between points A and B (i.e. 3 and 10 min).

