Figure 5.
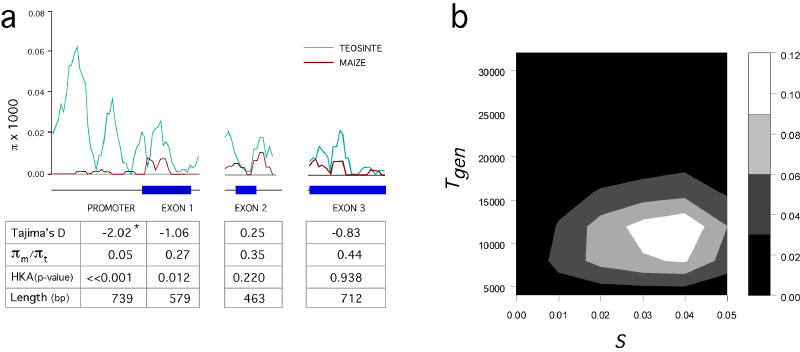
Molecular evolution. a, Nucleotide diversity (π) in maize and teosinte for tga1. Tajima’s D and HKA tests for non-neutral evolution and the ratio of π in maize to π in teosinte are shown. b, Joint distribution of the posterior probabilities (scale from white to black) for the time since fixation of the maize allele in generation (Tgen) and the selection coefficient (s).

