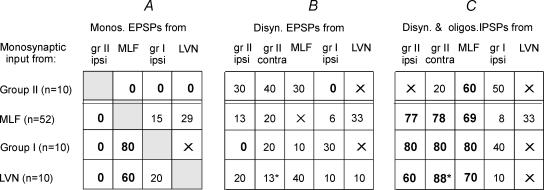
Figure 3. Proportions of intracellularly recorded commissural interneurones with monosynaptic EPSPs, disynaptic EPSPs and disynaptic and/or polysynaptic IPSPs from group I and II muscle afferents, MLF and LVN.
The table has four rows, for interneurones with monosynaptic input from group II muscle afferents, MLF, group I muscle afferents and LVN, as indicated to the left. The figures in the table show the proportions of the cells tested (as percentages) with other inputs, indicated at the head of each column. Note that the sums of the percentages across the rows may exceed 100% because individual interneurones could be coexcited from several sources. The proportions of particular interest, those exceeding 50% or found close to nought, are highlighted in bold. Figures with asterisk in the bottom rows are based on a sample of 8 (rather than 10) interneurones with monosynaptic input from LVN. An X indicates effects that were difficult to quantify, for example when disynaptic PSPs were obscured by being superimposed on monosynaptic EPSPs, and/or when the number of observations was insufficient for calculating proportions.

