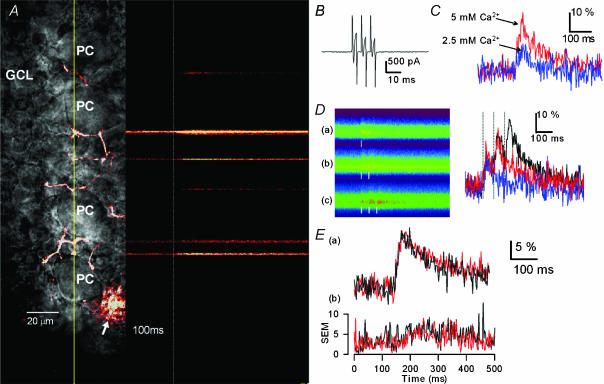
Figure 3. Action potential-induced Ca2+ transients in individual BC buttons and effects of ISP.
A, a representative image of a single BC and its neurites stained by a Ca2+-sensitive fluorescent indicator, Oregon Green 488 BAPTA-1 loaded through the recording patch electrode, and confocal line scans over the trajectory indicated by a yellow line passing over some of the contact sites between BC axonal boutons and PC bodies. Action potentials were evoked in the BC by injecting a train of three depolarizing pulses (from −60 to 0 mV for 3 ms) from the time point indicated by a dotted white line, and Ca2+ transients at individual BC buttons were determined by using a laser scanning confocal microscope. B, current responses induced in a BC by a train of three depolarizing voltage steps (from −60 to 0 mV for 3 ms). C, effects of changes in extracellular Ca2+ concentration ([Ca2+]o) from 2.5 to 5 mm on the action potential-triggered Ca2+ transients. The peak values of fluorescence signal changes (ΔF/F0, averaged trace of five trials) determined with a low-affinity Ca2+ indicator, Calcium Green 5N, increased from 13.8% in 2.5 mm [Ca2+]o to 27.9% in 5 mm [Ca2+]o. D, fluorescence images of line scanning at a single bouton recorded in response to single, two and three depolarizing pulses (left) and corresponding Ca2+ transients (right, averaged traces of three trials). Time points of depolarizing pulses are indicated by white vertical bars. The peak values of ΔF/F0 were 11.7% (single depolarizing pulse, blue), 27.4% (two pulses, red) and 31.5% (three pulses, black). Note that the signal intensity increased depending on the increase in the number of pulses, indicating no saturation in the detection capability. E, effects of ISP on the action potential-triggered Ca2+ transients determined by Calcium Green 5N. Ca2+ transients (ΔF/F0) were recorded in the absence (black trace) and presence of 20 μm ISP (red trace). Traces labelled (a) and (b) represent the mean and s.e.m., respectively, determined at different boutons derived from individually stained BCs (n = 8). The peak values and decay time constants of ΔF/F0 were 19.3 ± 3.4% and 92.5 ± 28 ms before ISP application, and 18.7 ± 4.2% and 102.3 ± 20 ms after ISP application, respectively.

