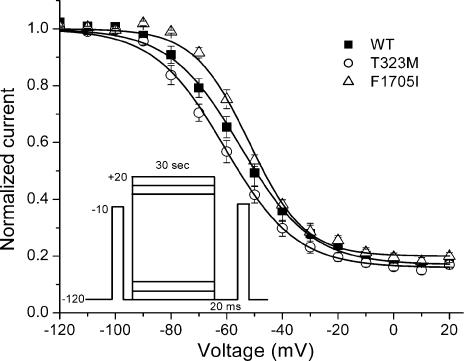
Figure 5. Voltage dependence of slow inactivation was similar for WT, T323M and F1705I channels.
Steady-state slow inactivation was measured as the relative Na+ current after a 30-s conditioning pulse and an intervening 20-ms recovery at −120 mV to remove fast inactivation (inset). Fitting the data with a Boltzmann function did not reveal a difference in the voltage for half inactivation or the maximal extent of slow inactivation for mutants compared to WT (see text).

