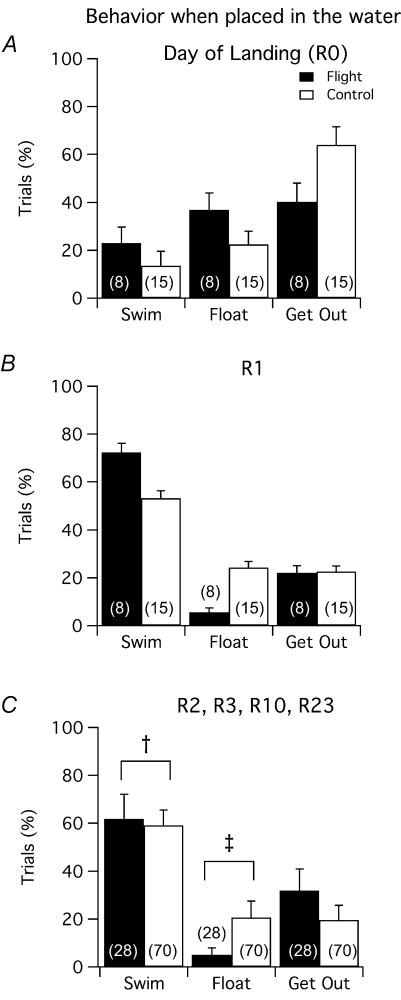
Figure 3. Distribution of activities in flight and control animals when placed in the water.
A, percentage of trials on day of landing in which flight (filled bars) and control (open bars) animals swam immediately, floated, or tried to leave the water. There were no significant differences between flight and control animals. B, similar to A for one day after landing. C, pooled data from R2, R3, R10 and R23 showing that the majority of animals swam immediately upon entering the water. Data are mean ± s.e.m.†P < 0.001, ‡P < 0.0001 unpaired t test; A and Bn = 8 flight, 15 control animals; Cn = 28 flight and 70 control animals.

