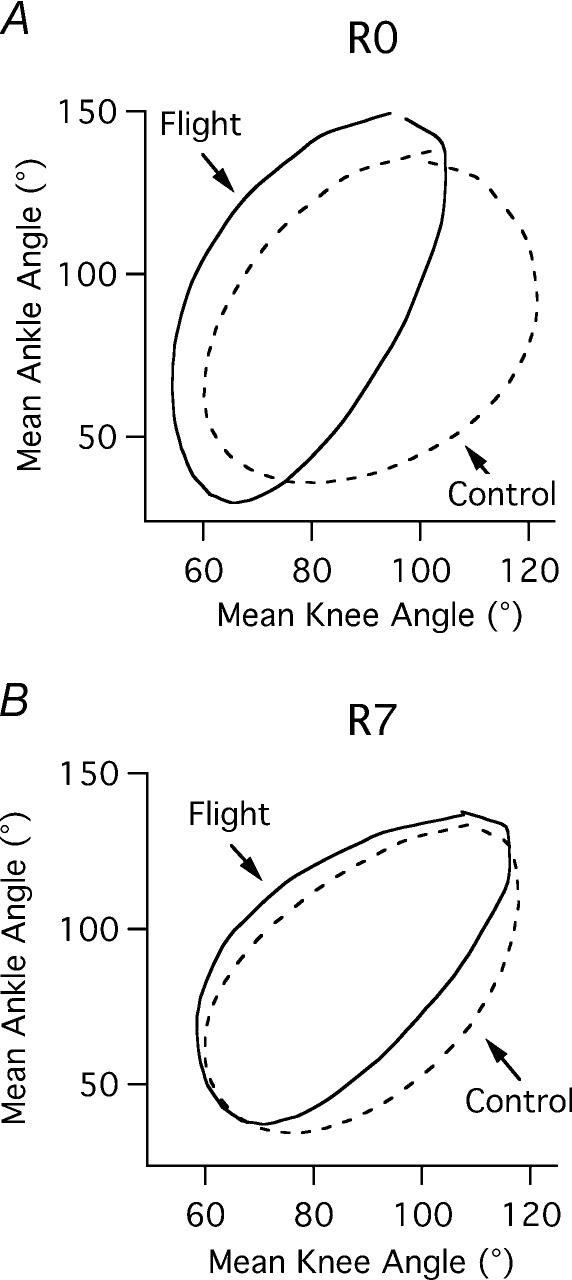
Figure 8. Mean ankle, knee joint–joint relationship in flight and control animals.
A, day of landing mean values for five flight (n = 40 strokes) and five control (n = 39 strokes) animals. Note the narrow range for the knee joint and that the loop is shifted to the left. There is a significant difference between the groups of animals throughout the stroke. B, similar to panel A for 7 days after landing. Significant differences remain between flight (n = 40 strokes) and control (n = 36 strokes) animals in the maximum ankle angle.

