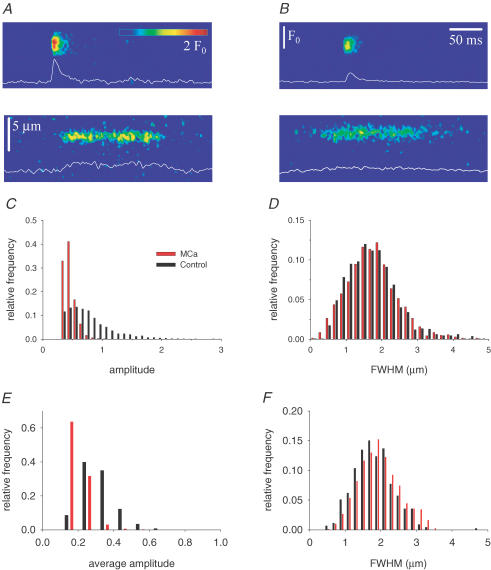
Figure 4. Depicted events from control and MCa-treated fibres.
A, a spark and an ember from a control fibre. B, a spark and an ember from a fibre in the presence of 50 nm MCa. Both fibres were in sulphate-based internal solution. White traces present the time course of fluorescence through the peak of the event (three neighbouring pixels averaged). C and E, distribution of event amplitudes for sparks (C) and embers (E). For embers the average amplitude of the ember was considered. D and F, distribution of full width at half-maximum for sparks (D) and embers (F). Only events with amplitude > 0.3 ΔF/F (for sparks) or average amplitude greater than 0.05 ΔF/F (for embers) were used to construct the histograms.

