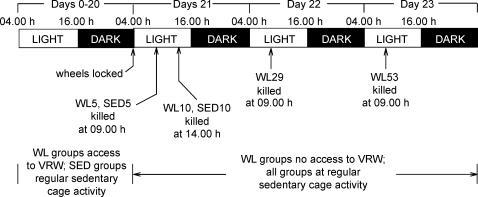
Figure 1. Experimental design.
The top two lines represent the time line. The bar represents the light : dark cycle. Preliminary studies showed that > 99% of the running occurred during the dark cycle (data not shown). Wheel lock (WL) groups were given access to voluntary running wheels (VRW) at the start of day 0. Groups with regular sedentary cage activity (SED) were housed without VRW. For WL groups, wheels were locked at 04.00 h on day 21 (bottom lines); arrows pointing to bar indicate the time of kill. Access to food was denied at 04.00 h on the day of kill for a given group. See Methods for more detail.

