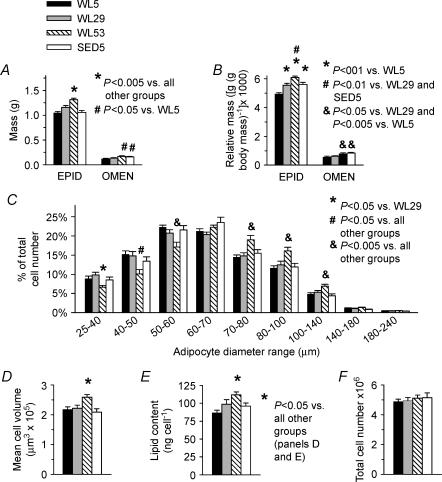
Figure 3. Adipose mass and cellularity.
Epididymal (EPID) and omental (OMEN) absolute (A) and relative (B) fat mass; C, relative epididymal adipocyte distribution based on cell diameter; D, mean epididymal adipocyte cell volume; E, epididymal fat cellular lipid content; and F, epididymal fat pad total cell number for both left and right pads. Bars represent the means ± s.e.m. Legends for significance are shown separately with each graph; D and E share a significance legend to the right of E. ANOVA with Student-Neuman-Keuls post hoc test was used for all comparisons. n = 26 for epididymal fat mass, 10 for omental fat, and 13–16 for cellularity measurements.

