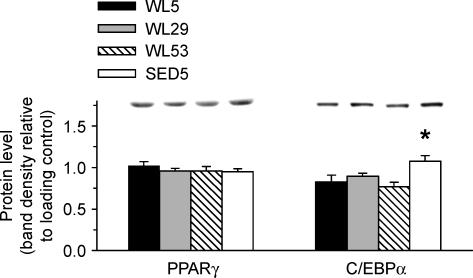
Figure 6. PPARγ and C/EBPα protein levels in epididymal fat.
Protein levels are relative to loading control (see Methods). A representative immunoblot for each protein is located above the graph. *Significantly different from all other groups (P < 0.05, ANOVA with Student-Neuman-Keuls post hoc test). n = 10 in each group.

