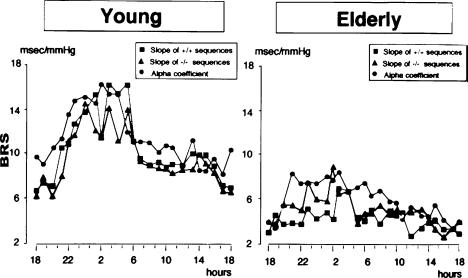
Figure 1. 24 h BRS profiles in young and elderly subjects.
Different symbols refer to different methods to assess spontaneous baroreflex sensitivity (modified from Parati et al. 1995, used with permission) slope of hypertension-bradycardia (+/+) sequences and of hypotension-tachycardia (−/−) sequences; alpha coefficient (square root of the ratio between systolic blood pressure and heart interval spectral powers in the frequency regions where these signals are coherent). (Modified from Parati et al. 1995, used with permission.)

