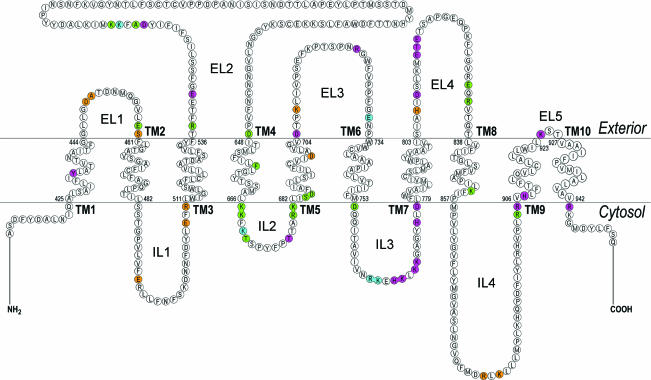
Figure 5. Amino acid mutations, which had a severe (< 25% of wt-kNBC1 function,  ), moderate (25–60% of wt-kNBC1 function,
  ) and a small (> 60% of wt-kNBC1 function,
  ) effect on kNBC1 function.
Designation of TMs, ELs and ILs is same as in Fig. 4. The residues that are required for plasma membrane expression are shown in brown.

