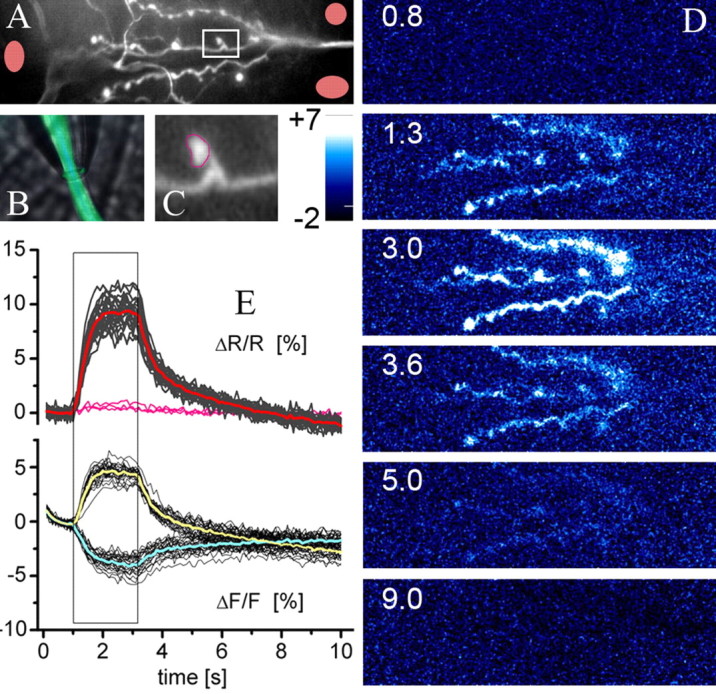
Figure 2.

Analysis of indicator performance at the subcellular level in larval NMJs of transgenic Drosophila. A, The raw image of an NMJ at muscle 6/7 shows that boutons can be visually identified by the indicator fluorescence at rest. B, The segmental nerve that harbors the relevant axons was placed in a stimulation electrode. C, The close-up of the bouton (marked by the white box in A) shows that individual boutons can be reliably identified for off-line analysis of fluorescence changes. D, Spatially low-pass-filtered false-color images encoding ΔR/R (no subtraction of the background in D and E) during the time course of an experiment (80 Hz stimulation for 2.2 s; see black box in E). The numbers (in seconds) indicate the time points at which the images were calculated. E, Off-line analysis of the fluorescence changes in ∼20 individual presynaptic boutons during the same experiment. Thin black traces represent signals from individual boutons, and mean ΔF/F calculated for CFP and YFP is plotted in cyan and yellow, respectively. The mean ΔR/R is shown in red. Signals from background regions (pink areas in A) are represented by pink traces. The background (i.e., the muscle cells) does not show fluorescence changes.
