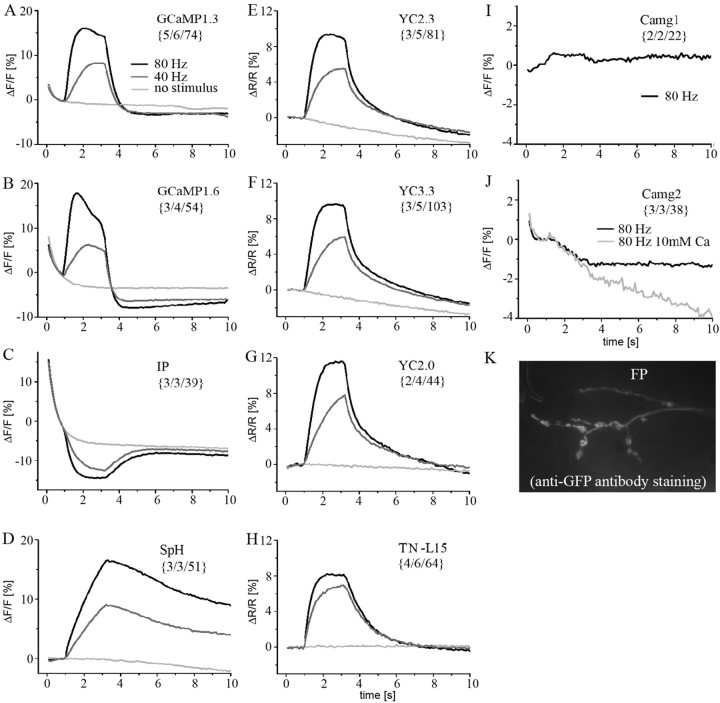
Figure 3.
Comparison of presynaptic fluorescence changes of 10 different GECIs and SpH. Presynaptic boutons were imaged and analyzed as described (see Fig. 2 and Materials and Methods). Calcium influx and vesicle fusion were evoked by electrical stimulation (80, 40, and 0 Hz, from t = 1 to 3.2 s) of the nerve. The exhibited mean ΔF/F and ΔR/R of sc and dc indicators, respectively, was calculated from the unmodified raw data and plotted versus time. The number of analyzed animals, NMJs, and boutons is indicated in brackets. NMJs expressing GCaMP1.3 (A), GCaMP1.6 (B), IP (C), SpH (D), YC2.3 (E), YC3.3 (F), YC2.0 (G), and TN-L15 (H) exhibited reliable fluorescence changes. At 40 Hz (data not shown) and 80 Hz stimulation, no or only very small signals, respectively, were recorded from Camg1-expressing (I) and Camg2-expressing (J) boutons. Increasing the extracellular calcium concentration to 10 mm (J, light gray trace) resulted in a degradation of the fluorescence signal that we cannot explain. FP-expressing animals (n > 10) were imaged by focusing on the cleft between muscle 6/7 because the FP fluorescence could not be detected at rest. Stimulation did not result in a detectable increase in fluorescence. After the imaging experiment, we verified FP expression in these NMJs by GFP antibody staining (K). UAS-Camg1-, UAS-Camg2-, and UAS-FP-indicator flies were tested for proper indicator insertion (see Materials and Methods). A detailed description of the fluorescence changes is given in Results and Table 1.

