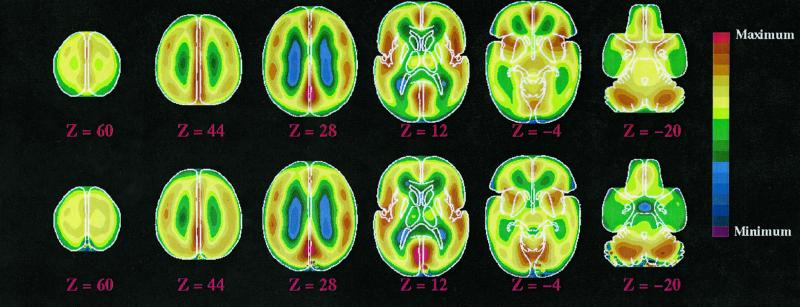
Figure 2.
Quantitative maps of blood flow (Upper) and oxygen consumption (Lower) in the subjects from group I while they rested quietly but awake with their eyes closed. The quantitative hemisphere mean values for these images are presented in Table 1. Note the large variation in blood flow and oxygen consumption across regions of the brain. These vary most widely between gray and white matter. Despite this variation, blood flow and oxygen consumption are closely matched, as also reflected in the image of the oxygen extraction fraction (i.e., the ratio of oxygen consumption to blood flow; see Fig. 4).

