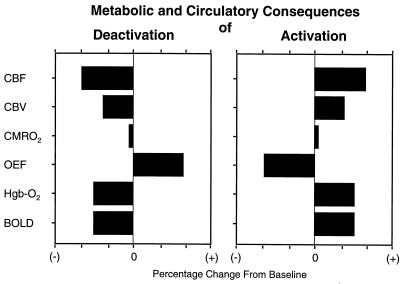
Figure 3.
A schematic representation of the metabolic and circulatory relationships occurring in areas of the brain with transient increases (Activation) or decreases (Deactivation) in the level of neural activity from a baseline or equilibrium state. Typically increases (Right) are characterized by increases in the cerebral blood flow (CBF) and the cerebral blood volume (CBV), with much smaller changes in the cerebral metabolic rate for oxygen (CMRO2). As a result, there is a fall in the oxygen extraction fraction (OEF) and an increase in the amount of oxygen attached to hemoglobin exiting the brain (HbO2). This latter change is responsible for the blood oxygen level–dependent (BOLD) signal used in functional magnetic resonance imaging (fMRI). Decreases from baseline (Left) are characterized as the opposite pattern of change.

