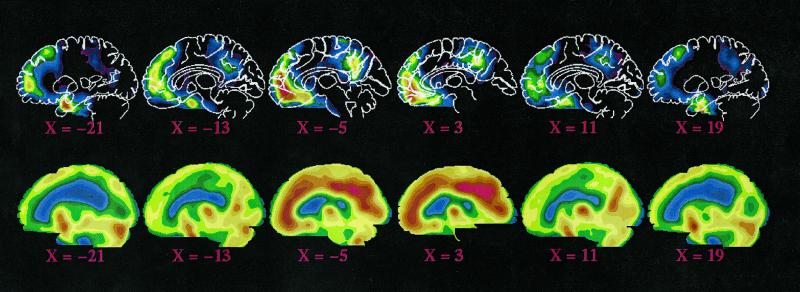
Figure 5.
Regions of the brain regularly observed to decrease their activity during attention-demanding cognitive tasks shown in sagittal projection (Upper) as compared with the blood flow of the brain while the subject rests quietly but is awake with eyes closed (Lower). The data in the top row are the same as those shown in Fig. 1, except in the sagittal projection, to emphasize the changes along the midline of the hemispheres. The data in the bottom row represent the blood flow of the brain and are the same data shown in horizontal projection in the top row of Fig. 2. The numbers below the images refer to the millimeters to the right (positive) or left (negative) of the midline.

