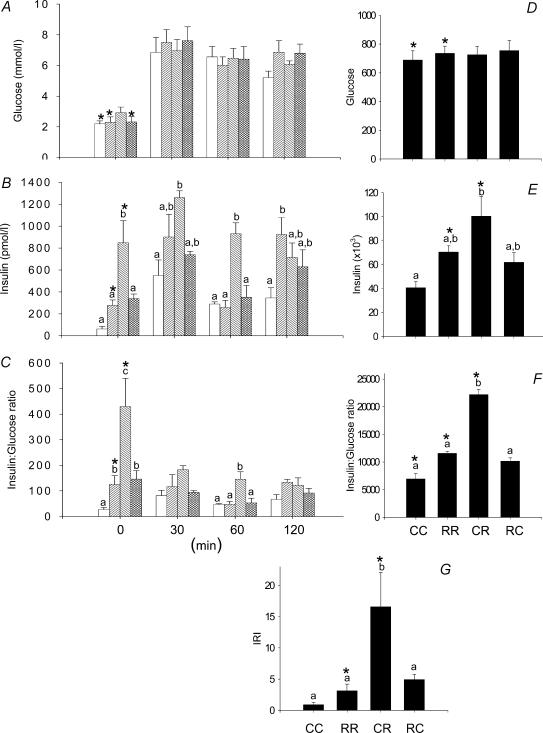
Figure 3. Results from the glucose tolerance tests performed in the F2 males at 110 days of postnatal life.
A, serum glucose; B, serum insulin; C, insulin to glucose ratio; D, area under curve for serum glucose during glucose tolerance tests; E, area under curve for insulin; F, area under curve for insulin:glucose ratio; G, insulin resistance index calculated as (glucose × insulin concentration)/22.5. Data represented as means ± s.e.m. from 5 CC litters, 5 RR litters, 6 CR litters, and 6 RC litters. Diets of F0 mothers are denoted as control (C) or restricted (R) during pregnancy (first letter), followed by lactation (second letter). CC: control–control  ; RR: restricted–restricted
  ; CR: control–restricted
  ; RC: restricted–control
  . P > 0.05 for data with at least one letter in common. *P < 0.05 versus female.

