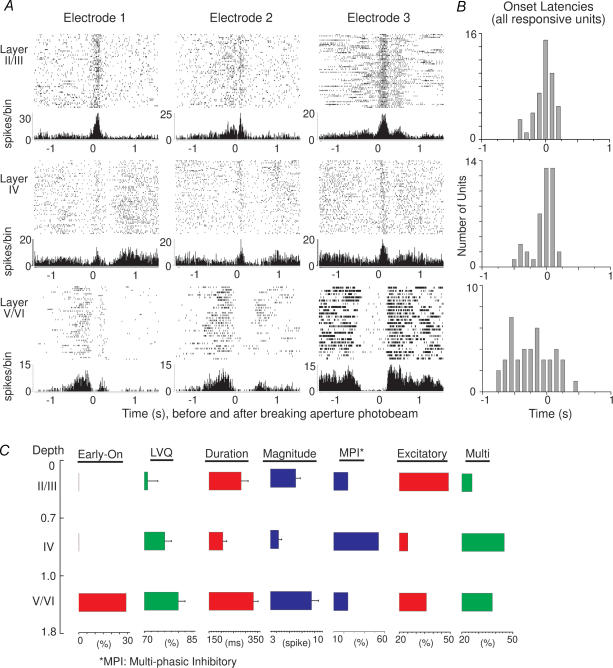
Figure 5. Neural response properties during active discrimination.
A, examples of single-unit responses recorded at different depths along 3 different electrode tracks during the active discrimination (wide aperture). Units recorded in infragranular layers respond significantly earlier than units in more superficial layers and before whiskers contact the aperture. B, distribution of onset-latencies for all responsive cells recorded in the different layers during active discrimination. C, summary diagram showing significant major effects across layers during active discrimination. The Early On column shows the percentage of units showing early onsets per layer. LVQ: mean (+ s.e.m.) performance of the LVQ for populations recorded at the different depths. Duration: mean (+ s.e.m.) excitatory response duration. Magnitude: mean (+ s.e.m.) magnitude of excitatory responses. MPI: distribution of units with multiphasic responses that began with an inhibitory phase. Excitatory: percentage of units with excitatory responses. Multi: percentage of multiphasic units. From Krupa et al. (2004). Reproduced with permission.

