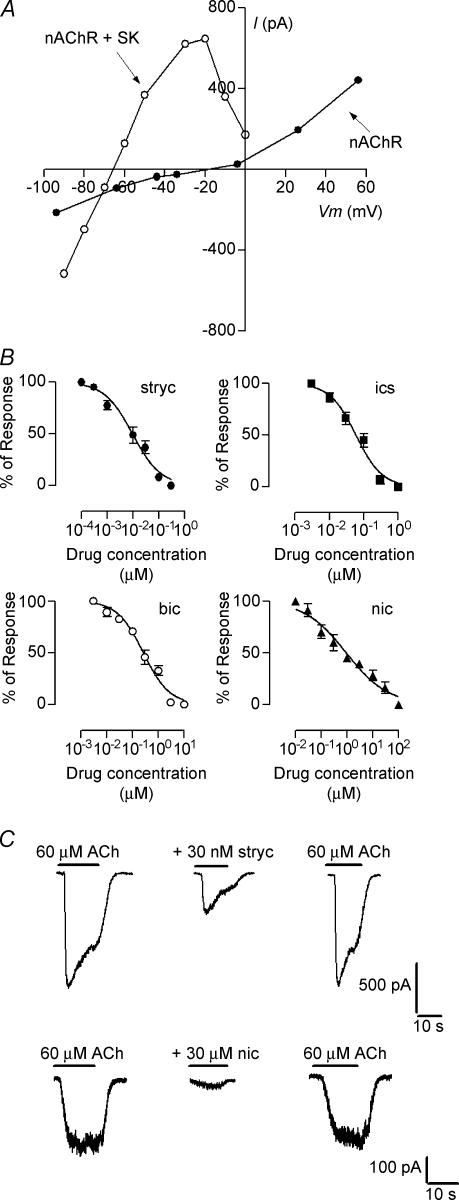
Figure 1. Voltage sensitivity and pharmacological profile of the native IHC nAChR.
A, representative I–V relationships illustrating the voltage dependence of the combined (nAChR + SK, KCl-EGTA saline solution in the recording pipette) and isolated responses (nAChR; CsCl-BAPTA saline solution in the recording pipette plus 1 nm apamin in the extracellular solution) evoked by exogenously applied ACh (100 μm). B, concentration–response curves in the presence of different antagonists: strychnine (IC50: 8.6 ± 0.8 nm; nH: 0.65 ± 0.1); ICS-205930 (IC50: 59 ± 4 nm; nH:1.2 ± 0.2), bicuculline (IC50: 0.3 ± 0.02 μm; nH: 0.9 ± 0.1) and nicotine (IC50: 1 ± 0.1 μm; nH: 0.5 ± 0.1). Responses were normalized to the response obtained with 60 μm ACh in the absence of antagonist. C, representative records of currents evoked by 60 μm ACh in the absence or presence of different concentrations of only two of the antagonists used (strychnine and nicotine). In all cases the effects of the antagonists were completely reversed by washing the cells in a saline solution without antagonist. In A and B, the records and data points for I–V and concentration–response curves are representative of results obtained in 3–6 IHCs. In B and C all ACh responses were elicited in IHCs voltage clamped at –90 mV.

