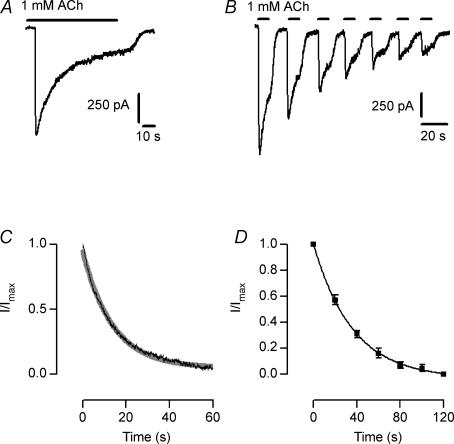
Figure 2. Desensitization pattern of the native IHC nAChR.
Representative records illustrating that ACh-evoked responses desensitize both for the continued (A) and intermittent application of ACh (B), obtained in 3–4 IHCs voltage clamped at –90 mV. C, plot of I/Imaxversus time during the continuous application of 1 mm ACh. Illustrated is the average trace obtained from 4 IHCs. The grey line is a monoexponential fit to the data (τdecay = 13.8 ± 0.5 s). D, plot of I/Imaxversus time during the intermittent application of ACh. Data points are the average current amplitudes (n = 3 IHCs) at each subsequent ACh pulse. Data were fitted by a monoexponential decay equation; τdecay = 37.9 ± 4.2 s.

