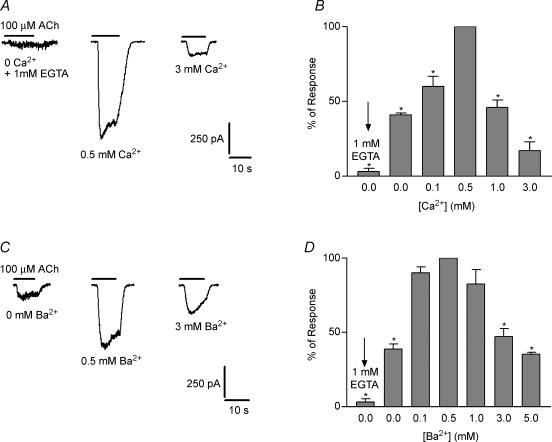
Figure 4. Modulation of the isolated nAChR by Ca2+ and Ba2+.
A, representative records of currents evoked by 100 μm ACh in the presence of different concentrations of Ca2+. B, bar graph illustrating that in the physiological range Ca2+ both potentiates and diminishes ionic currents through the nAChR studied in isolation from the SK channels. C and D, the same as A and B but in the presence of Ba2+ instead of Ca2+. Asterisks indicate that the amplitudes obtained at a given Ca2+ or Ba2+ concentration were significantly different from that obtained at 0.5 mm for either cation. All experiments were carried out in IHCs voltage clamped at −90 mV (n = 3–7 cells). Mean current amplitudes used to normalize the data in the bar graphs were: −752.4 ± 49.6 pA (n = 7 IHCs) and −480 ± 99 pA (n = 7 IHCs) in 0.5 mm Ca2+ and 0.5 mm Ba2+, respectively. Slope conductances at −90 mV were 8.4 ± 0.5 nS and 5.3 ± 1.1 nS in 0.5 mm Ca2+ and 0.5 mm Ba2+, respectively.

