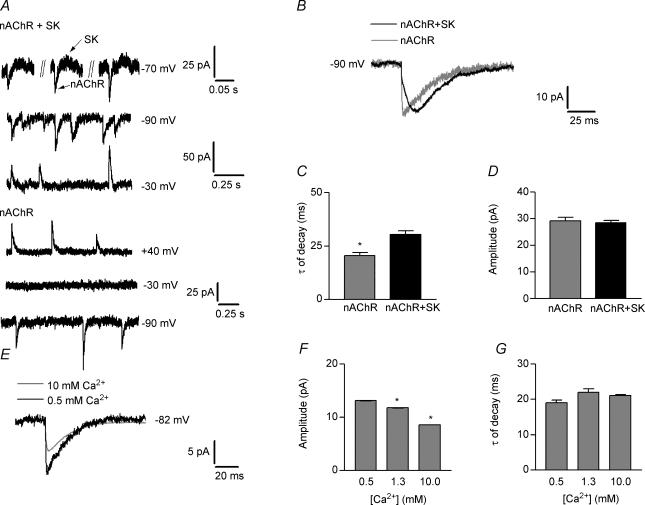
Figure 8. Ca2+ modulation of isolated nAChR spontaneous synaptic currents.
A, representative recordings of combined (nAChR + SK) and isolated (nAChR) spontaneous synaptic currents at different voltages. Note that at −70 mV, the trace is biphasic (arrows) in the combined current records. B, superimposed averages of combined (black) and isolated (grey) synaptic currents. C and D, bar graphs showing τ of decay and amplitudes, respectively, of the combined nAChR + SK and isolated nAChR synaptic currents. Note that amplitudes are not significantly different whereas τ of decay is significantly faster in the isolated nAChR synaptic currents. E, superimposed averages of isolated synaptic currents recorded in the presence of 0.5 (black) and 10 mm (grey) Ca2+ in the extracellular solution. F and G, bar graphs showing that synaptic current amplitudes (F) are significantly reduced in the presence of 1.3 and 10 mm Ca2+ with respect to the amplitudes obtained in the presence of 0.5 mm Ca2+ and that no changes were found in τ of decay (G) upon varying the external Ca2+ concentration. All experiments were carried out in IHCs voltage clamped at −90 mV.

