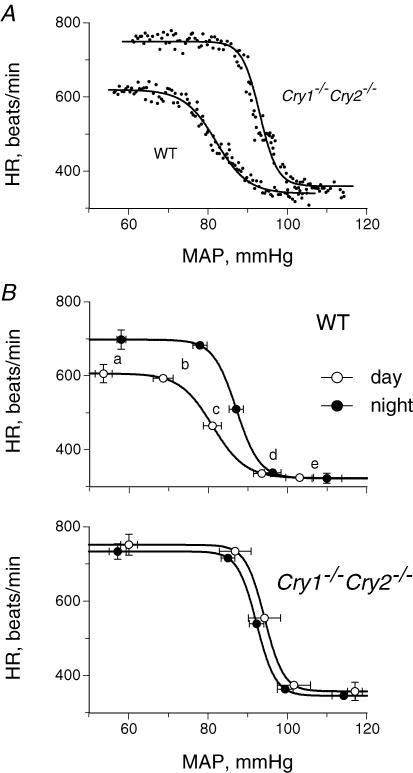
Figure 3. The relationship between MAP and HR after an injection of phenylephrine or sodium nitroprusside.
A, typical examples of a wild-type (WT) and a Cry1−/−Cry2−/− mouse in the day. 111 measurements are presented for each mouse. The best-fit sigmoid baroreflex curve generated is also presented as described in the text. B, composite baroreflex curves and baroreflex parameters for WT and Cry1−/−Cry2−/− mice in the day and night are presented: a, maximum; b, threshold; c, midpoint; d, saturation; e, minimum. Points show means ± s.e.m. for 6 WT and 5 Cry1−/−Cry2−/− mice.

