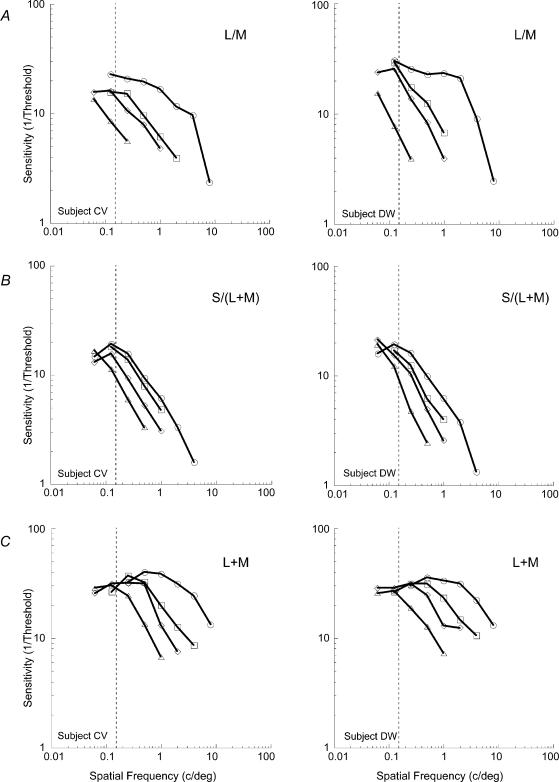
Figure 3. Sensitivity as a function of spatial frequency across eccentricity for the three post-receptoral mechanisms.
Results show the measured chromatic (L/M (A) and S/(L + M) (B)) and achromatic (L + M (C)) visual sensitivity for two subjects (C.V. and D.W.) at 0, 5, 10 and 20 deg eccentricity. Note that progressively lower spatial frequency stimuli are required for the eccentric positions in order to reach the same level of performance as that at the fovea. ○: 0 deg; □: 5 deg; ⋄: 10 deg; ▵: 20 deg. Average standard error approximated to the size of the data points.

