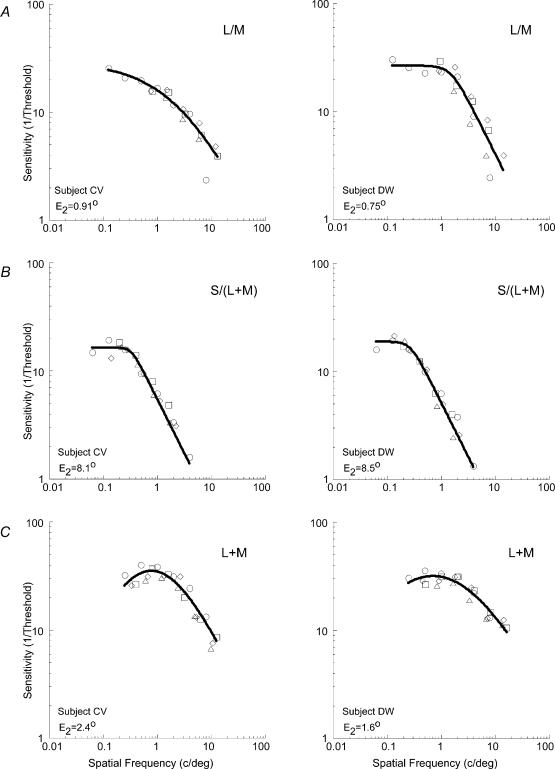
Figure 4. The data of Fig. 3, scaled to account for eccentricity.
Scaled data of visual sensitivity for the two observers are shown. For each observer, the graphs from Fig. 3A–C were scaled by an estimated E2 value, and the residual variance was calculated with eqn (3) (for A and B) and eqn (2) (for C). The three parameters of the curve fit were allowed to float in order to minimize the residual sum-of-squares deviation of the combined eccentricity data around the curve fit. With an iterative procedure an E2 value was found to minimize the overall residual variance for each observer: C.V. = 97.41%, D.W. = 94.34% (A); CV = 97.19%, DW = 98.31% (B); CV = 92.81%, DW = 92.75% (C). ○: 0 deg; □□: 5 deg; ⋄: 10 deg; ▵: 20 deg. Very different scaling factors were found for the three post-receptoral mechanisms, each depending upon the axis of colour or contrast.

