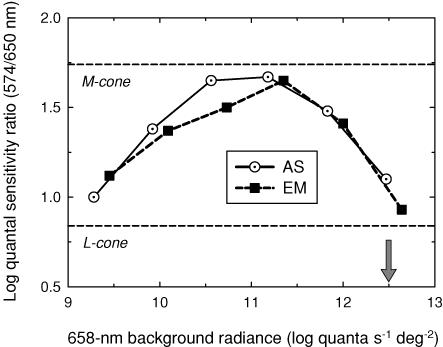
Figure 2. Quantal sensitivity ratios.
Sensitivity ratios for detecting 574 and 650 nm 16 Hz flicker measured as a function of 658 nm background radiance for AS (dotted circles) and EM (filled squares) compared with the 574/650 nm ratios predicted for M-cone (upper dashed line) and L-cone (lower dashed line) detection by Stockman & Sharpe (2000). The arrow indicates the radiance used in the experiments illustrated in Fig. 3.

