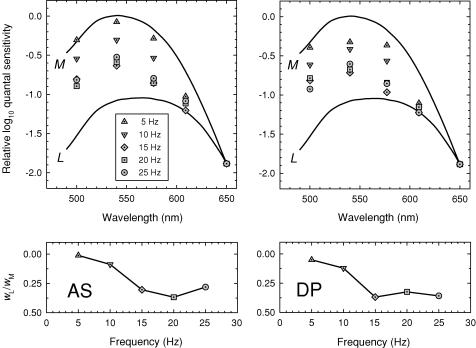
Figure 3. Spectral sensitivities and cone weights.
Upper panels: flicker spectral sensitivities for 5 Hz (triangles), 10 Hz (inverted triangles), 15 Hz (diamonds), 20 Hz (squares) and 25 Hz (circles) flicker compared with the Stockman & Sharpe (2000) M-cone (upper continuous line) and L-cone (lower continuous line) fundamentals. Backgrounds: 12.55 log10 quanta s−1 deg−2, 658 nm, and 10.32 log10 quanta s−1 deg−2, 410 nm. Lower panels: ratios of L- and M-cone weights wL/wM (see eqn (1)). Subjects: AS (left panels) and DP (right panels).

