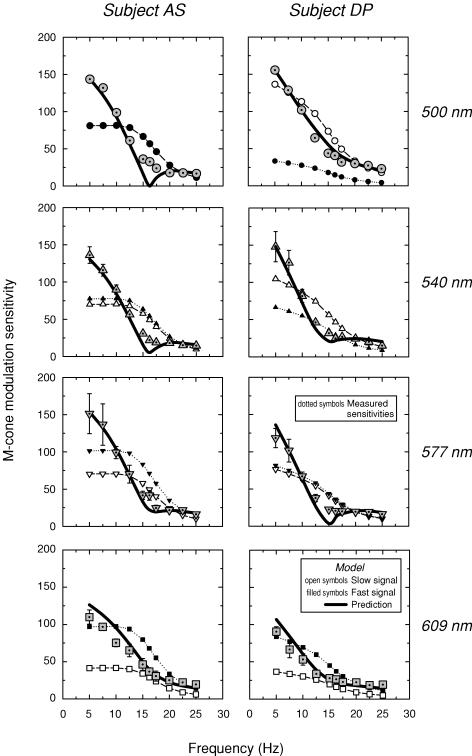
Figure 7. Modulation sensitivities (subject AS).
Modulation sensitivities for AS (left panels) and DP (right panels) obtained with the 500 nm (dotted circles, upper panels), 540 nm (dotted triangles, upper middle panels), 577 nm (dotted inverted triangles, lower middle panels) and 609 nm (dotted squares, lower panels) modulated targets. Conditions as Fig. 4. The predicted modulation sensitivities (continuous lines) are calculated from the assumed slow (open symbols) and fast (filled symbols) modulation sensitivities using parameters obtained from fits of the time delay model to the phase delay data (see Fig. 4). For details, see text.

