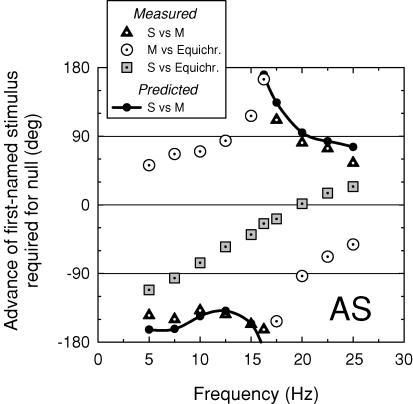
Figure 12. Phase differences between M- and S-cone and equichromatic flicker.
Phase advances of (i) an S-cone-detected 440 nm target of 9.09 log10 quanta s−1 deg−2 required to null an M-cone-isolating paired 577 and 656 nm stimulus of 9.66 and 10.61 quanta s−1 deg−2, respectively (black dotted triangles); (ii) the M-cone-isolating 577 and 656 nm stimulus required to null an equichromatic 656 nm target of 11.36 log10 quanta s−1 deg−2 (open dotted circles); and (iii) the S-cone-detected target required to null the 656 nm target (grey dotted squares). The filled circles and continuous lines show the phase differences between the S-cone and M-cone stimuli predicted from the phase differences measured between (ii) the M-cone and 656 nm equichromatic stimuli and (iii) the S-cone and 656 nm equichromatic stimuli. The targets were presented on a 658 nm background of 12.40 log10 quanta s−1 deg−2. Subject: AS.

