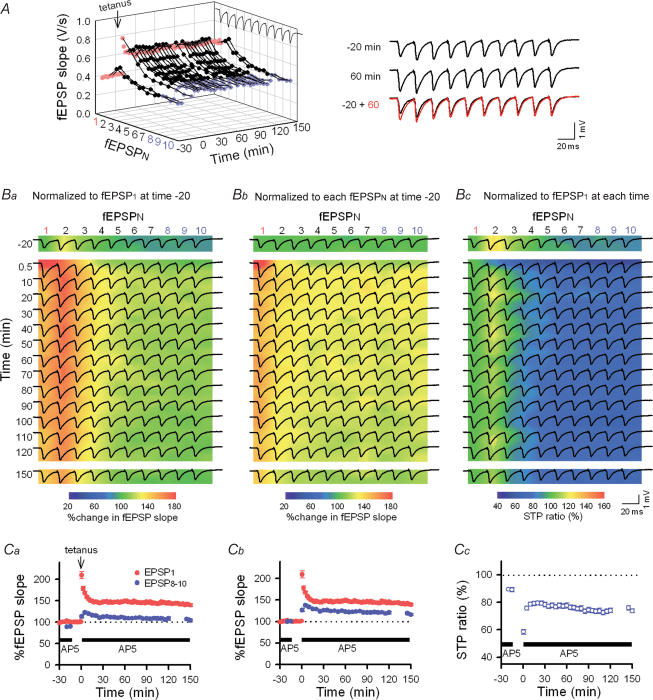
Figure 2. Changes in the STP profiles (i.e. RSE) induced by LTP induction at Schaffer–CA1 synapses.
A, time course of LTP monitored by single-pulse stimuli (every 30 s, red). LTP was induced by tetanic stimulation (100 pulses at 100 Hz) at time 0 min and maintained over 150 min. To monitor the response to burst firing, 10-pulse trains at 40-Hz were applied at times −20, −15, 145 and 150 min and every 5 min during time 0.5–120 min. AP5 was absent during the period from time −15 to 0 min. The right panels show burst responses at time −20 and 60 min. Note that the degree of potentiation was smaller in later responses in a burst (fEPSP8–10, blue) as compared to the initial response (fEPSP1), which is indicative of RSE. B, traces of synaptic responses (the same data as the panel A) are superimposed onto the pseudocoloured images that show ratios of individual fEPSPs to fEPSP1 at time −20 min (Ba), to the corresponding fEPSPN at time −20 min (Bb), and to fEPSP1 at each time point, i.e. the STP ratio (Bc). C, average data for each parameter in the panel Ba–c (n = 8 slices). The degree of a change in fEPSP8–10 was smaller than that seen in fEPSP1, that is, the STP ratio was reduced after LTP induction. This change was maintained over 150 min.

